|
Hurricanes Katrina and Rita were two storms that devastated Louisiana and the northern coast of the Gulf of Mexico, and their effects will be felt for many years. The Center for Computation & Technology at Louisiana State University, is a part of several inititiaves that are using supercomputers to perform simulations of tropical storm and hurricane events, in order to better understand the science of storms and ensure more accurate predictions in the future.
Central to this research is surge data obtained from LSU's Hurricane Center. Based on the ADCIRC model, this data accurately models the storm surge caused by the hurricane. This particular data set covers the southeast US, resolving from the Atlantic ocean to the channels within New Orleans, showing the increasingly intense surge that ultimatelybreached the levees and flooded the city. Other data sources shown include the wind field and GIS data displaying the topography beneath.
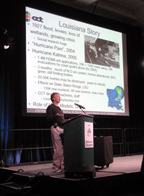
Ed Seidel, CCT director
|
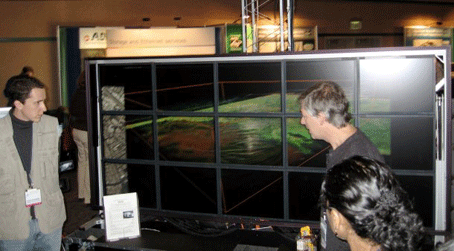
Utilizing this information, CCT researchers created a visualization for the general public to easily interpret the significance of the data. The results were shown at Supercomputing 2005 in Seattle, on a high-resolution stereo display device at the NCSA booth and a tiled display at the National Lambda Rail booth. The high-resolution NCSA display was developed by VisBox Inc. in cooperation with NCSA. Visualizations such as these serve to provide the public as well as scientific audiences a chance to better interface with the data, resulting in a more detailed, complete idea of what really happened. |
Group Effort and Results (communication map)
In a full group effort with many contributing pieces, we managed to integrate all data using Amira. In the choreography that was put together for SC05, we initially see the surge front induced by Hurricane Katrina as it runs over the Gulf of Mexico and slams into Louisiana. This run is replayed and we zoom in to see the details of the surge.
Download the Katrina Visualization in Quicktime:
uncompressed (344.4 Mb) | 300Kbps (3.5 Mb) | 800Kbps (9.2 Kbps) |
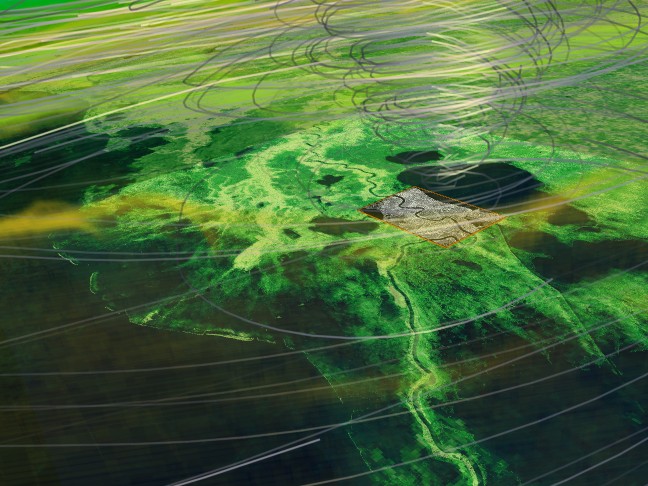 |
Here, the visualization fades over to a display of the atmospheric wind field and temperature field. The wind field, a vector field, is visualized using the technique of illuminated stream lines. This helps to display integral lines at each time step of a vector field. As designed for a visualization method for static vector fields, these stream lines may vary significantly from one time step to another. In the case of the MM5 data used here, data are available for each 30 minutes in real time, so the time jumps from one frame to the next accordingly. This was possible, as the vortex of the hurricane's eye provided a clearly visible, stable point of reference for all time steps. Overlaid with the streamline visualization is the temperature field of the atmosphere. It is displayed via volume rendering and matches with the streamlines of the wind field. In the movie, the surge data is hidden to allow concentration on the atmospheric data. Katrina is followed as the hurricane traverses the city of New Orleans, where her eye moves just over the heart of the city, continuing on a deadly path into Lake Pontchartrain. |
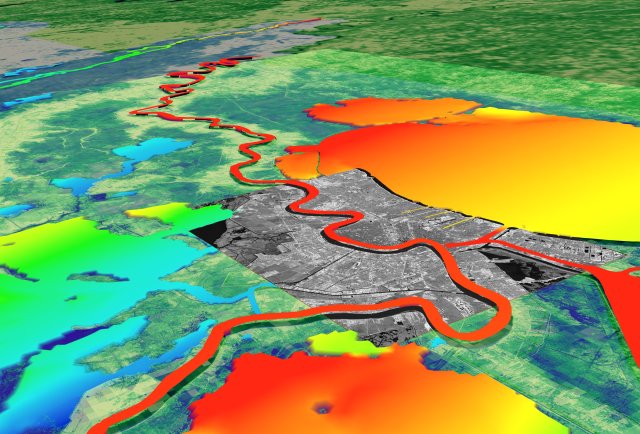 |
Here the evolution of the atmospheric data is stopped in order to zoom in to a closer view of the city. Replaying the evolution of the ADCIRC surgedata enables the detailed effects on Lake Pontchartrain to be evaluated. Through the extreme resolution of the surge data images, one can easily identify the Mississippi river and the channels. The height field display of the elevation data clearly depicts the intensity of the flood.
|
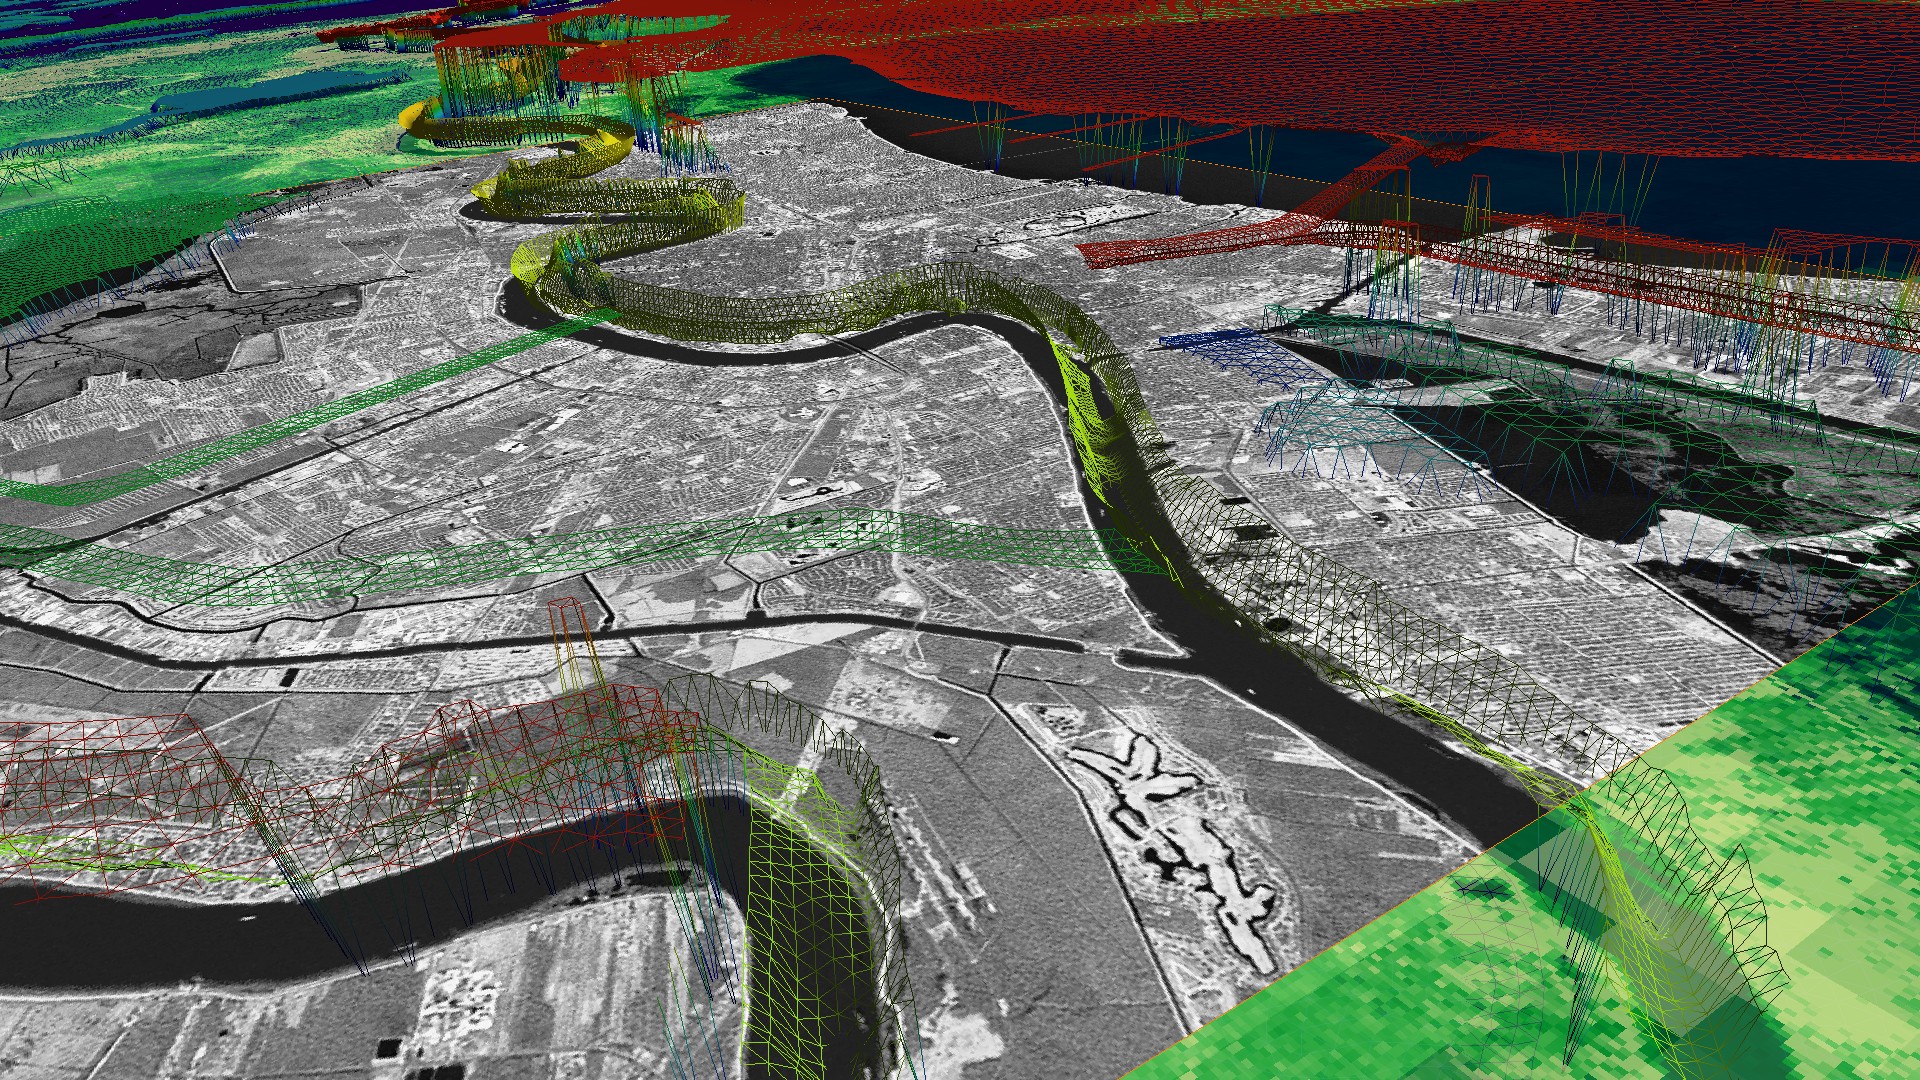 |
At the last frame, the shaded display of the surge surface is withheld, depicting the high resolution triangular grid that was used for the simulation. Also, the same frame depicts the multiple layers of GIS data of various resolutions that contribute to the holistic visualization. |
Technical Approach
On the technical side, the data consisted of a triangular surface with evolving elevation data on each vertex, as provided by the ADCIRC model,
GIS data, time-dependent three-dimensional vector and scalar field data given in volume, originating from the MM5 simulation model. The visualization tool used for this project was Amira; it provides advanced visualization methods for vector fields and stereographic display of three-dimensional renderings, based on OpenGL.
Shalini Venkataraman, Werner Benger |
Central to the project was the need to be able to read all these different data representations. Using the GIS data proved most simple, CCT's partners could deliver the data in GEOTIFF format, which is directly readable by Amira. Using the ADCIRC data required more effort. While a version of an ADCIRC reader for Amira already existed, it turned out to be too slow-ADCIRC in its native form is ASCII, and parsing this huge amount of data took several minutes. |
Also, all timesteps of the evolution had been loaded in memory instantly. To address these issues, the data was converted to HDF5 format and enabled Amira to read surfaces in this format. As a result, loading these large datasets only required a fraction of a second instead of minutes. Moreover, due to the integrated caching algorithms in the HDF5 library itself, each time step is loaded on demand when accessed. The elevation data of the surge front was available as a scalar field, and as our intent was to display the surge accurately as an elevation above some zero level, an Amira extension module was written that displays a surface scalar field as a height field.
As for an holistic approach showing the wind field on top of the surge data, we first had to find a source that could provide use such data. The MM5 data also were new to us, and we had to first understand how to read them. There was a tool to convert the native MM5 binary format into NetCDF, which made the data accessible as datasets with attributes. Still, we need to learn how to interpret these and how to bring them into a form that Amira could understand. It turned out that the way a vector field is stored in the MM5 layout is quite different from the way as Amira required it: the components of the vector fields are stored as different scalar fields, and the ordering of height is reversed as what Amira could use. We had to write another customized file converter here, utilizing HDF5 as final format again, for the same reason as before.
Using HDF5 for all involved kinds of data types allowed to benefit from similarities and to share code. We made use of the mathematical model of fiber bundles to layout the data in the HDF5 format.
Credits
• LSU CCT: Werner Benger, Shalini Venkataraman, Gabrielle Allen,
Steve Beck, Chirag Dekate, Jon MacLaren, Cornelius Toole, Brygg Ullmer,
Steve Brandt, Brian Ropers-Huilman, William Scullin, Sam White, Edward Seidel
• Hurricane Center: Ivor van Heerden, Paul Kemp, Hassan Mashriqui
•
Earth Scan Laboratory: Nan Walker, Sreekanth Balasubramaniam, Alaric Haag
• WAVCIS: Greg Stone, XP Zhang
• CLEAR: Carola Jesch, Robert Twilley, Karen Westphal
• CSI: Dewitt Braud
• UNO Lake Pontchartrain Institute
• SURA SCOOP: Phil Bogden (Maine), Brian Blanton, Gerry Creager,
Rick Luettich (UNC), Mesonet (Texas A&M)
• NCSA: Stuart Levy, John Towns
• EVL: Maxine Brown, Jason Leigh
• Notre Dame: Johannes Westerink
• NLR: Tom West
• Scripps Institution of Oceanography
• RSMAS-AMP - Miami: Hans Graber, Niel Williams
• USGS: John Barras, Brady Couvillion
• National Science Foundation - Dynacode Project
• NOAA, ONR, SURA - SCOOP Project
• Text: Werner Benger, Jesse Hoggard
|
