SciViz@CCT at Supercomputing 2012
 Download this page in PDF format

Demonstrating Vish at the Supercomputing 2012 Conference – 4D Interactive Exploration of a 280GB Dataset on a common deskop PC.
What if you could interactively navigate in a data set of several hundred gigabytes right from your desktop computer?
Doing so would allow to explore and analyze computational results from HPC computations as easy as browsing a website, allowing to identify and discover unexpected features in the simulation. Several months of computation time may be evaluated and assessed in seconds.

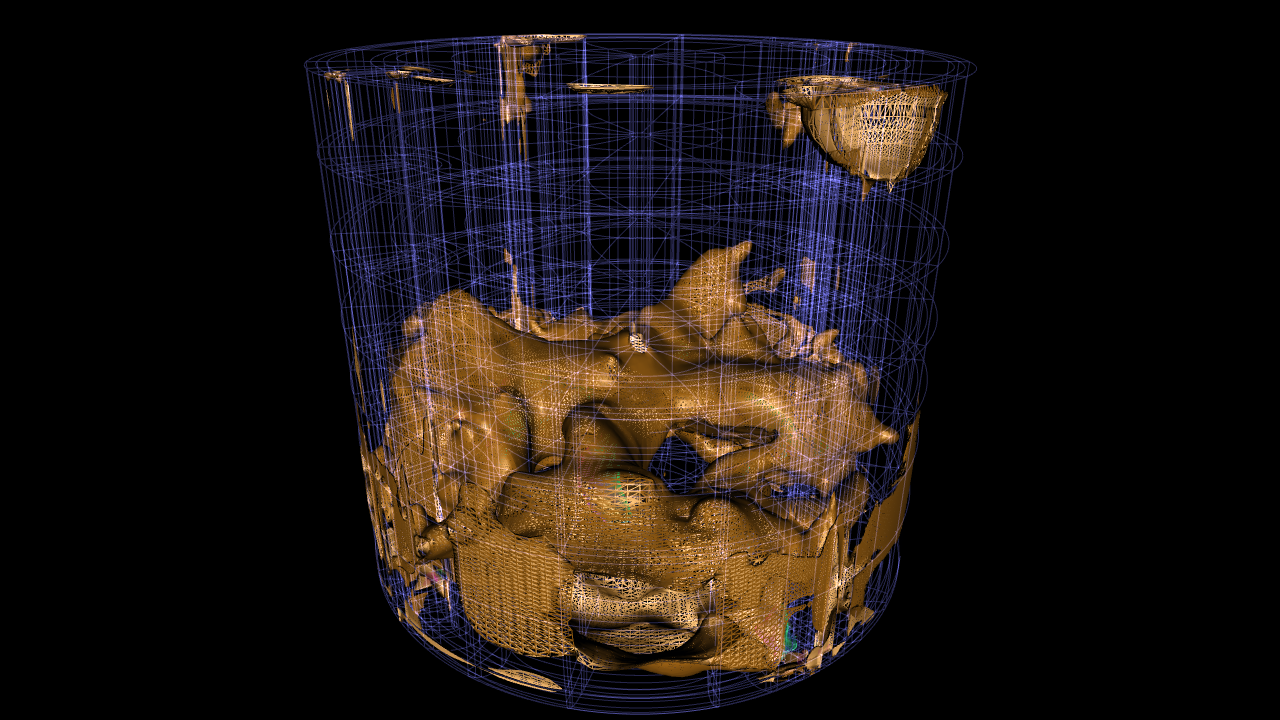
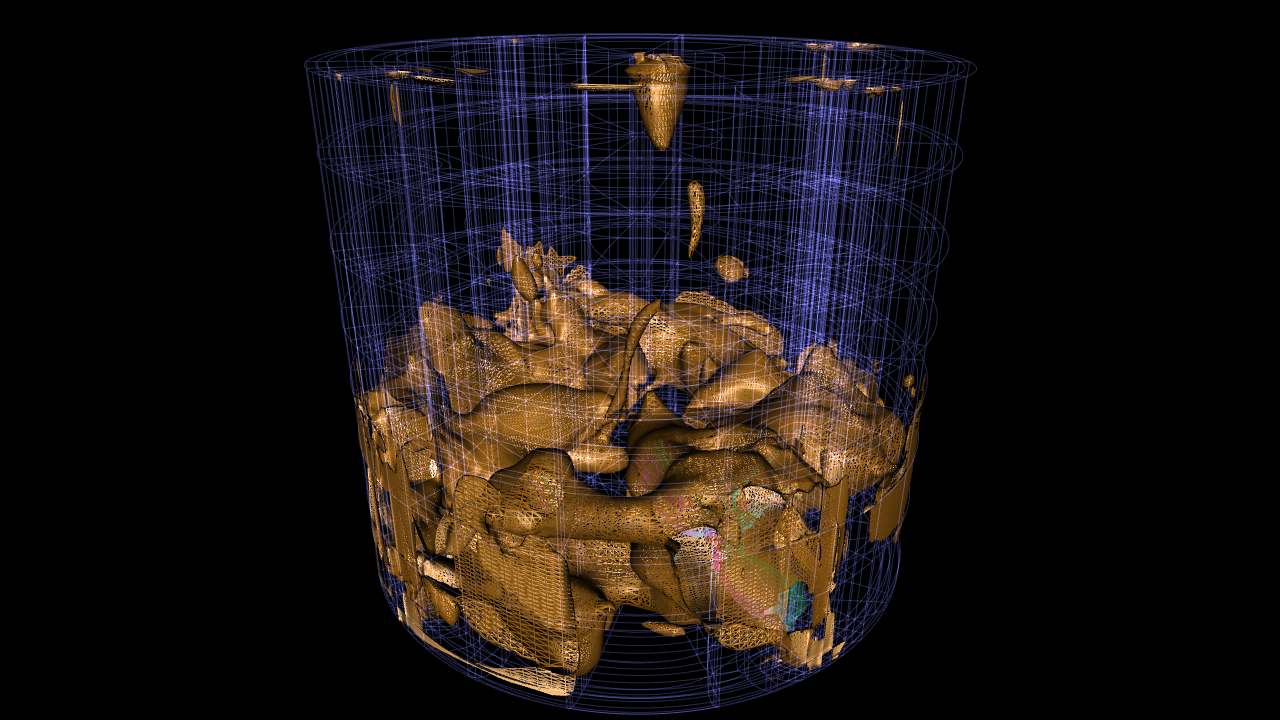
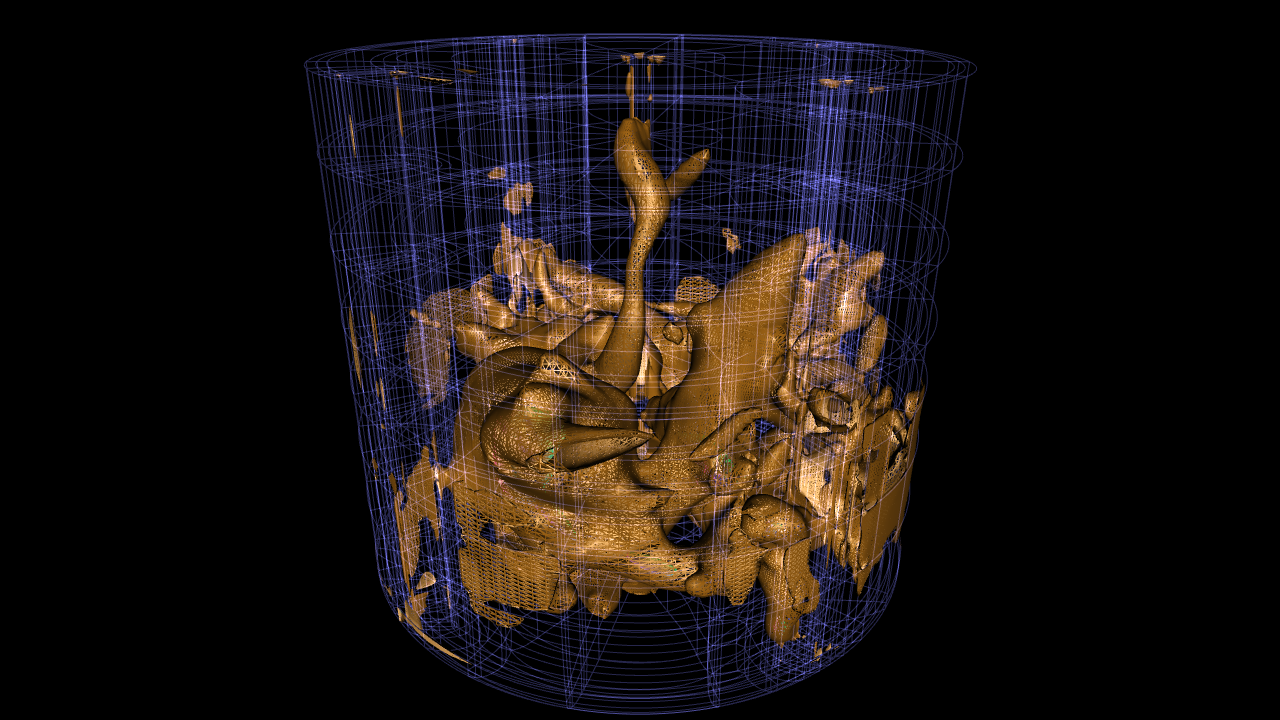
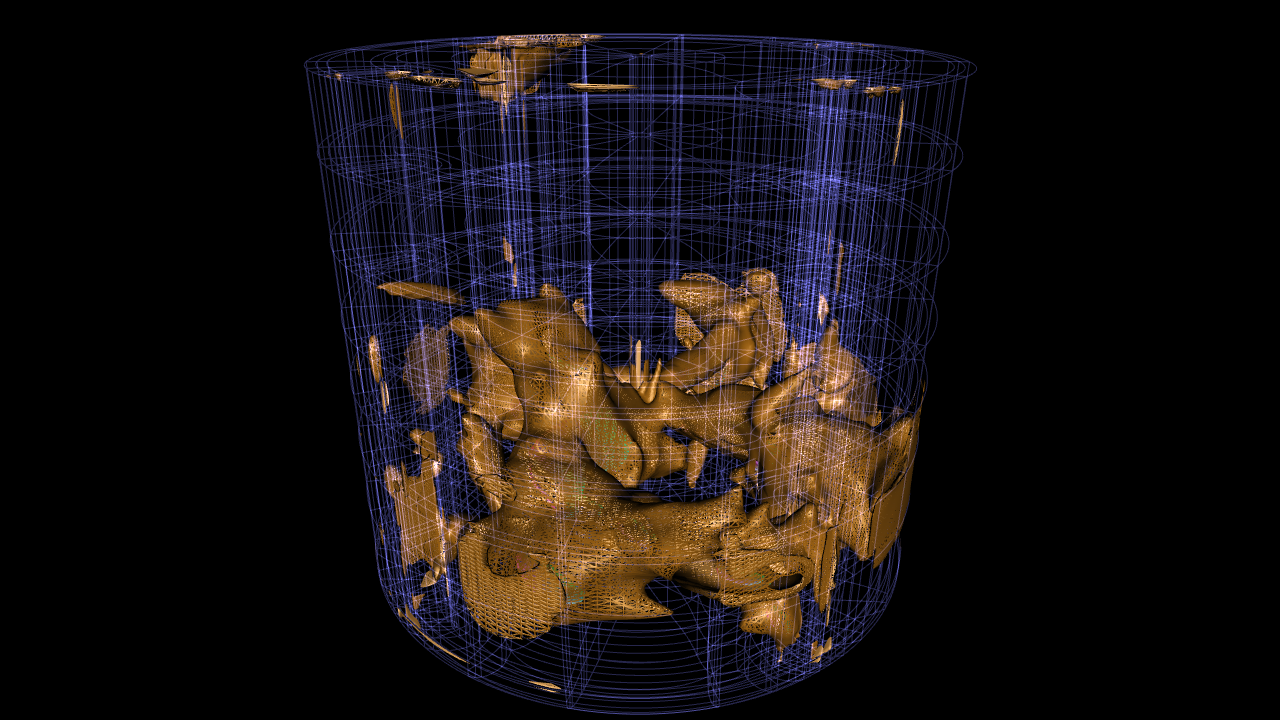
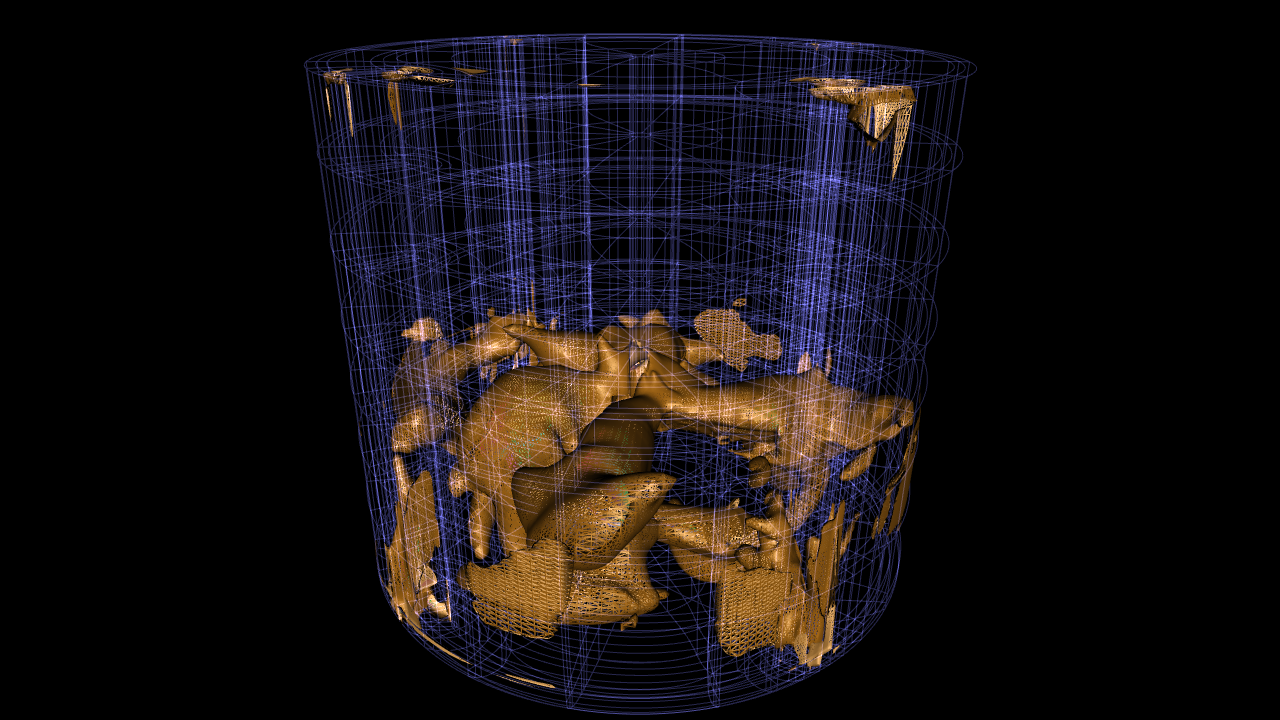
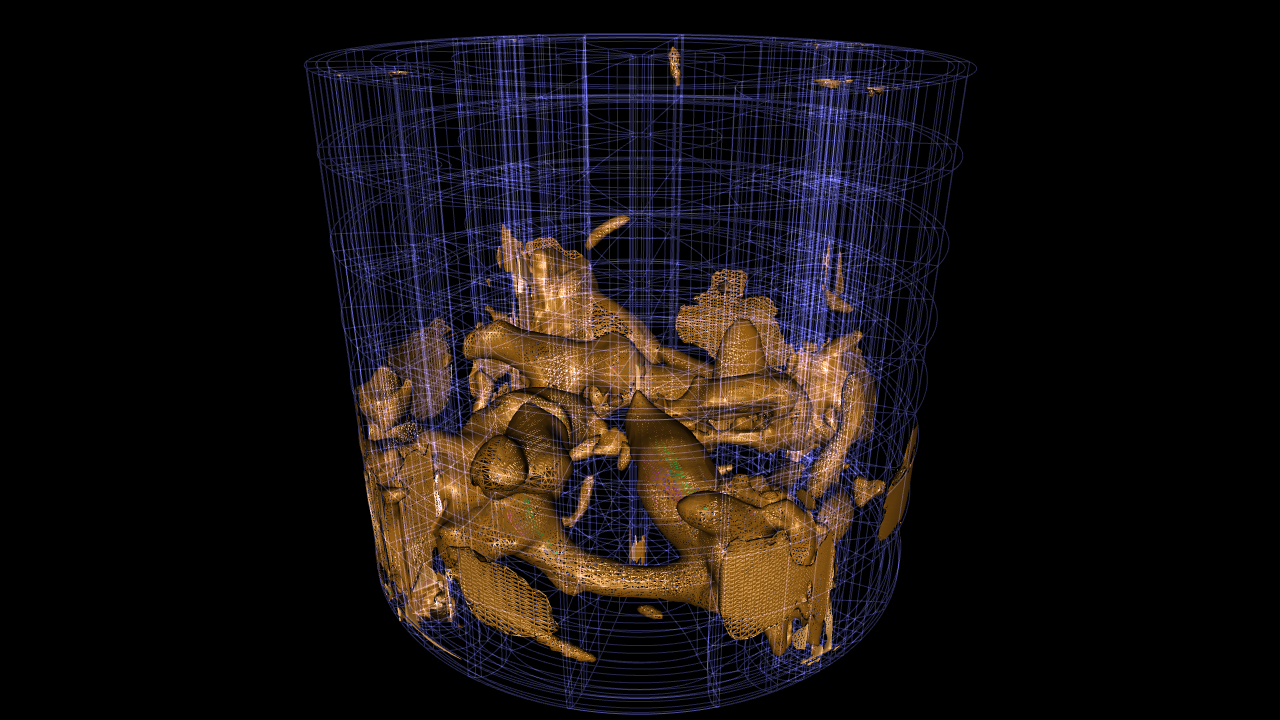
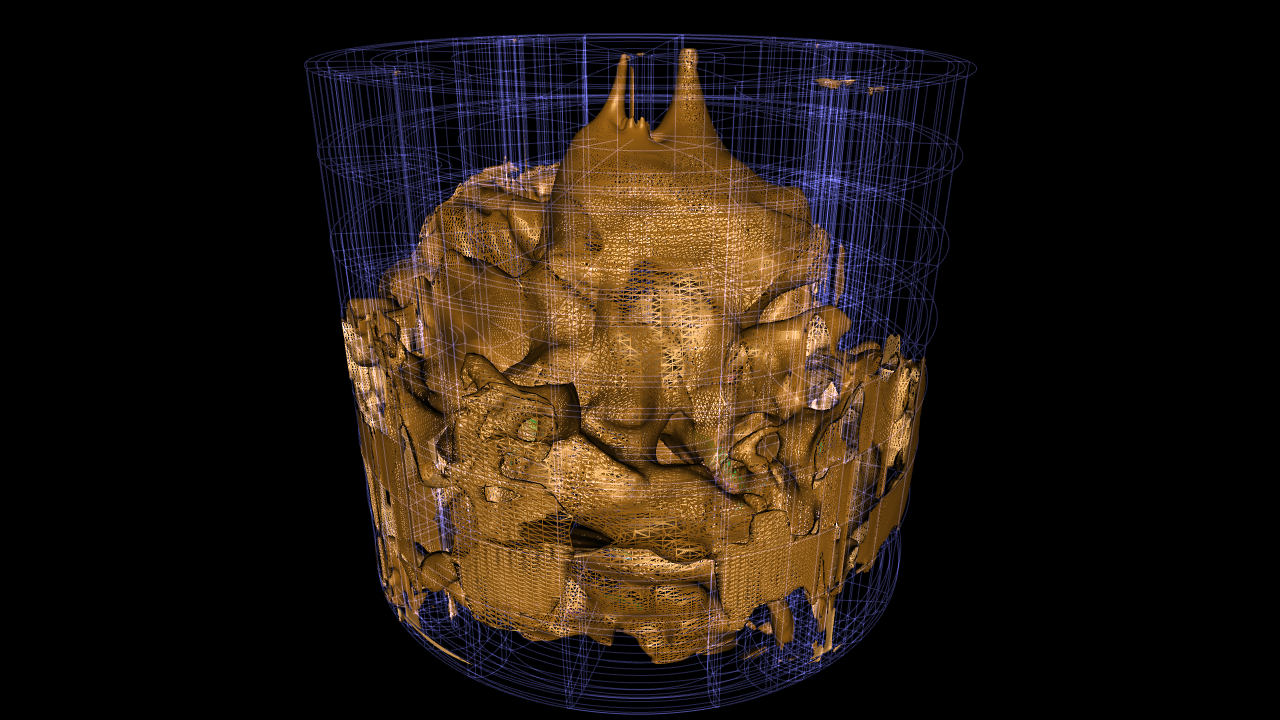
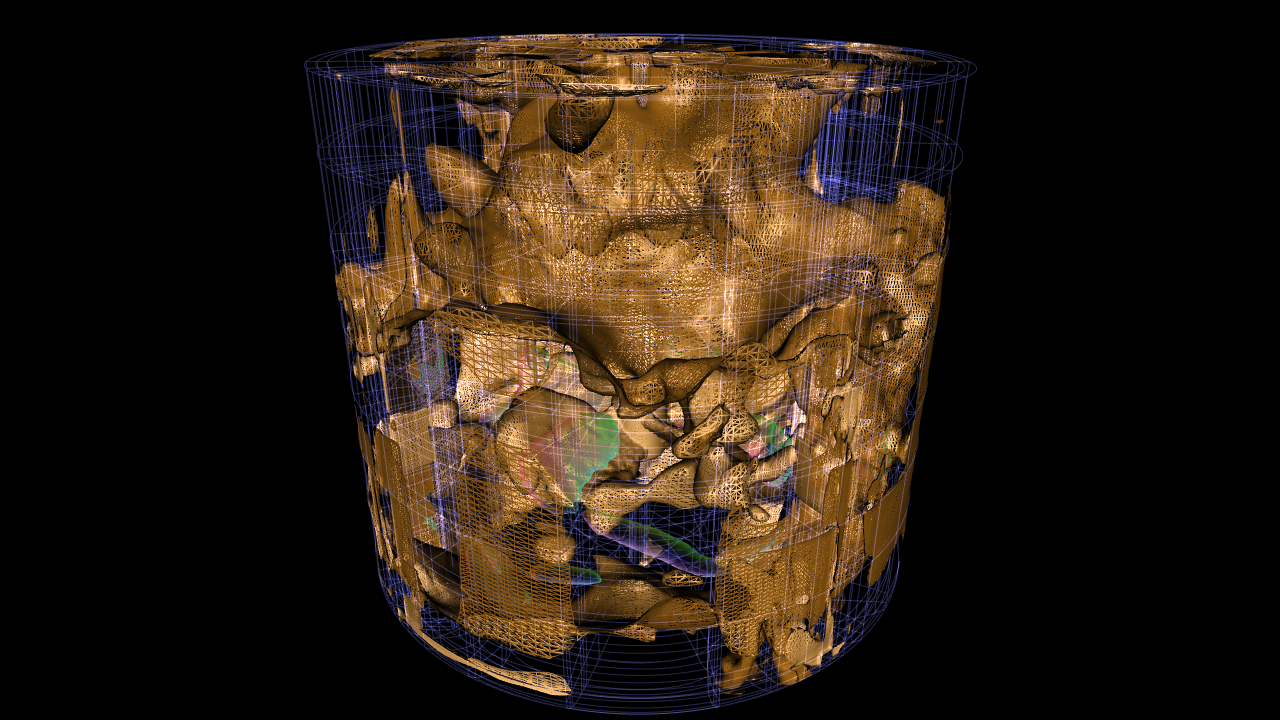
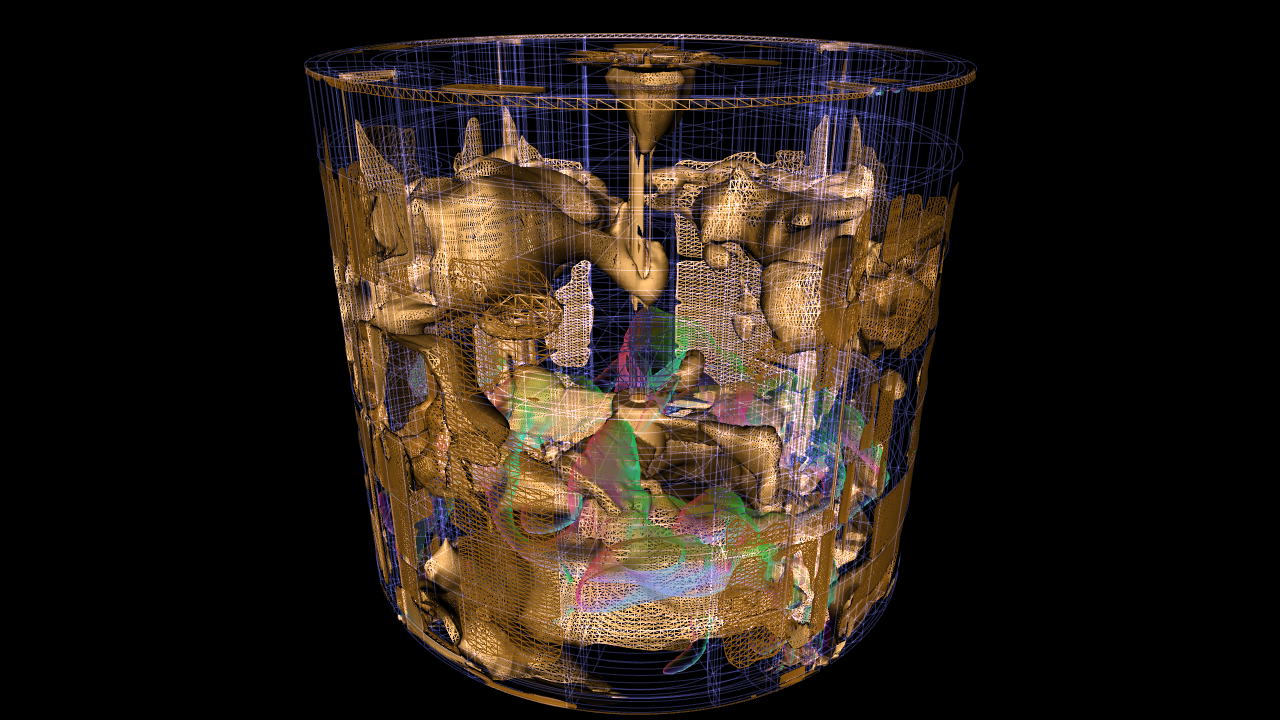
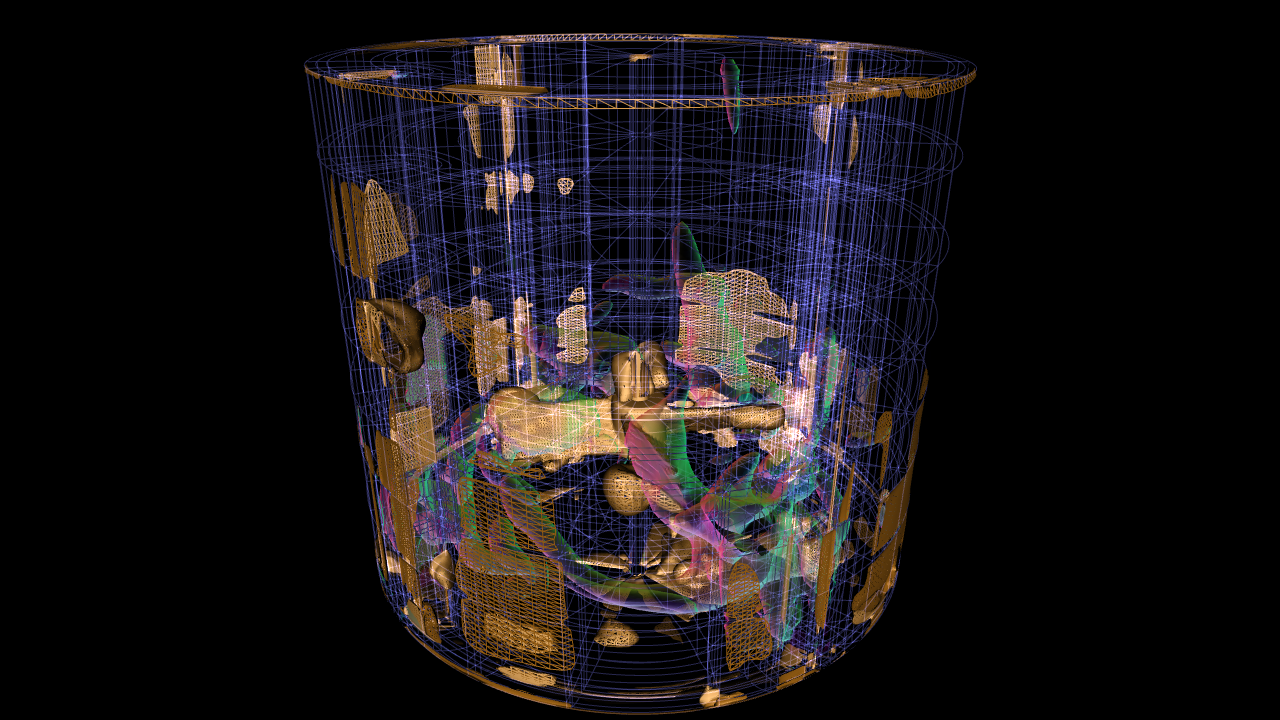
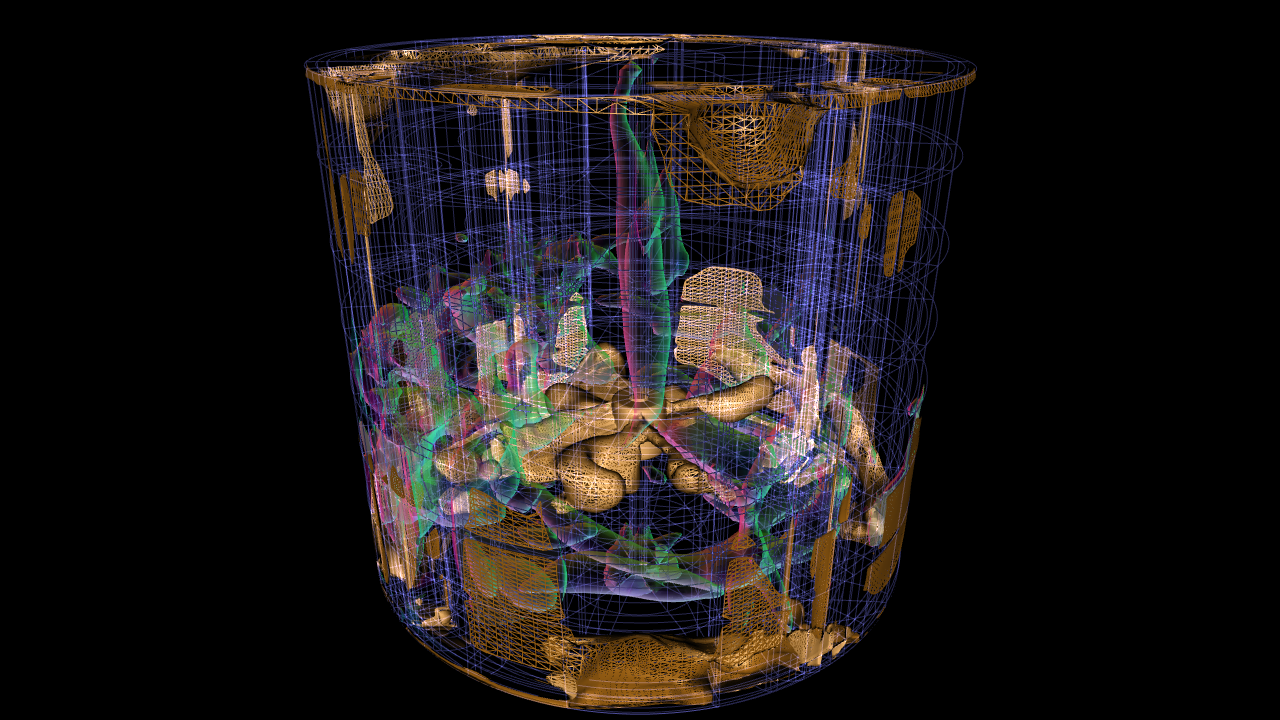
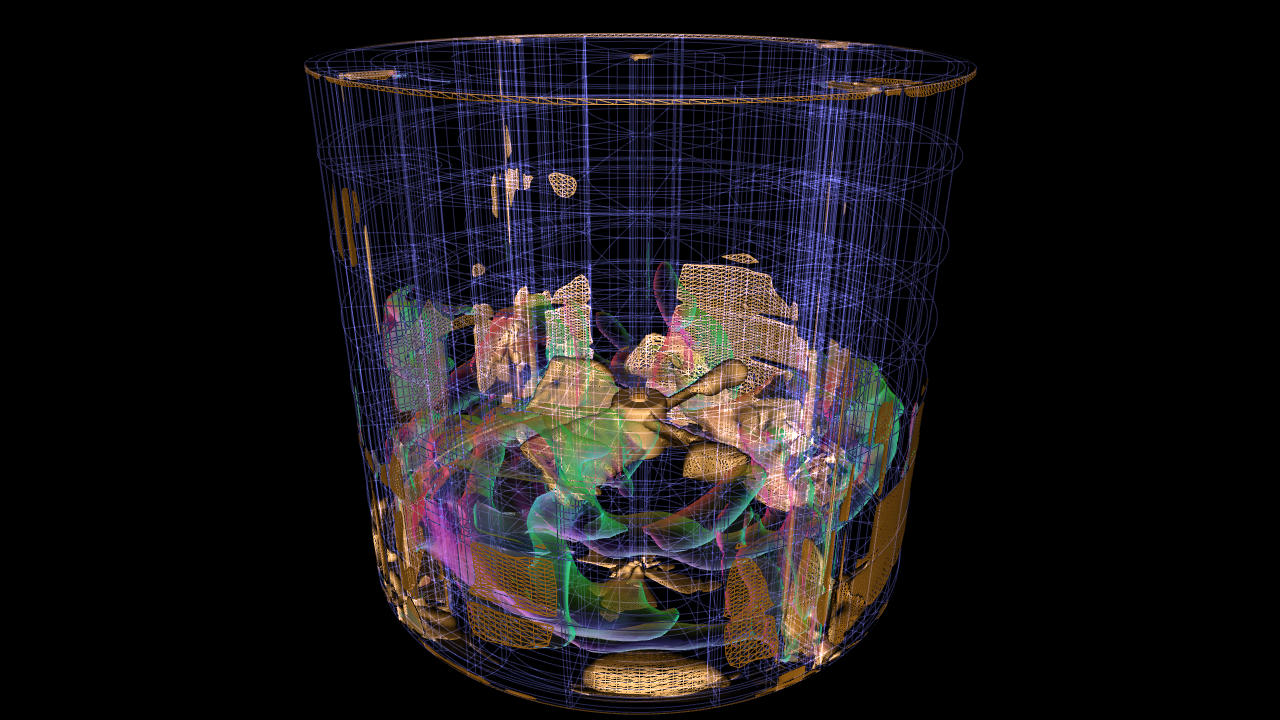
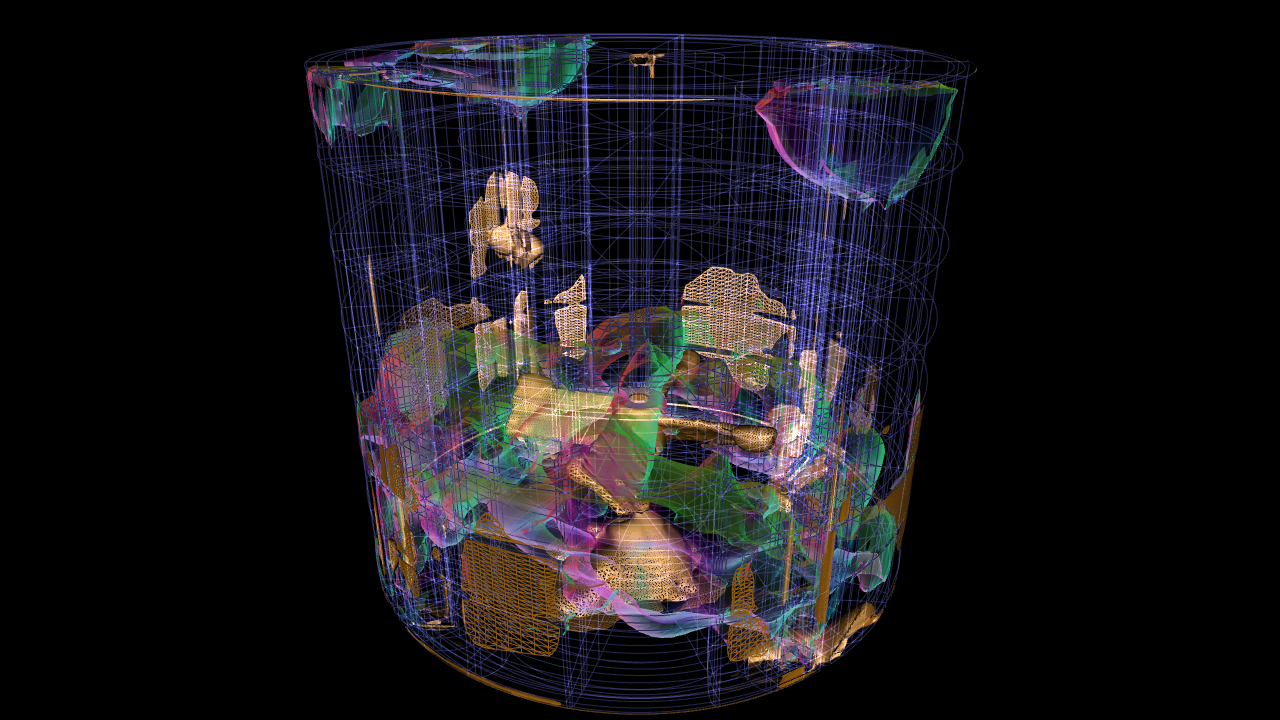
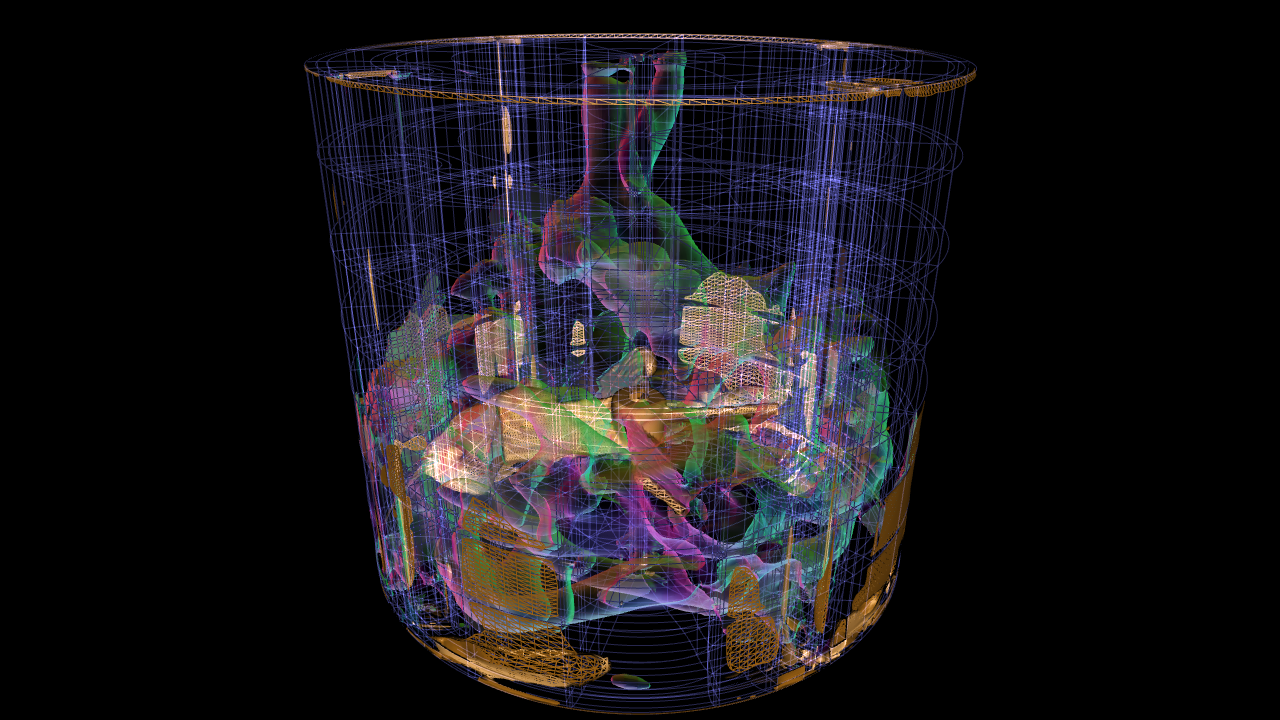
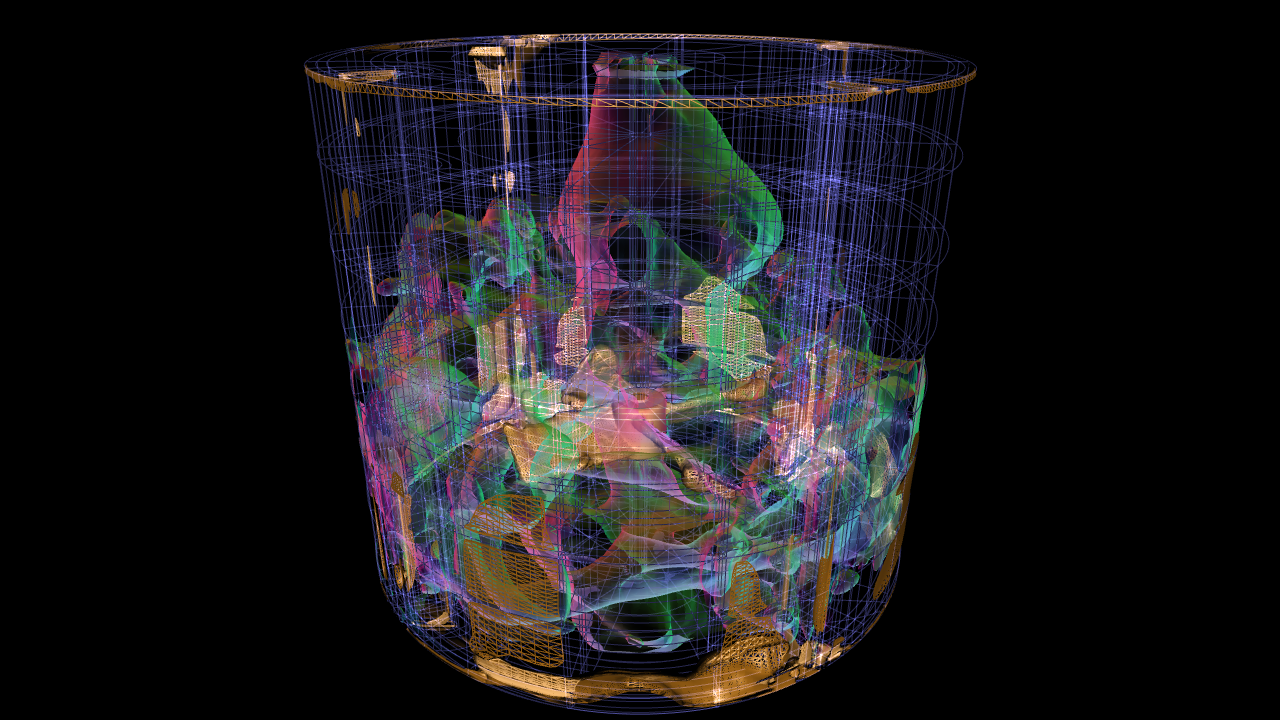
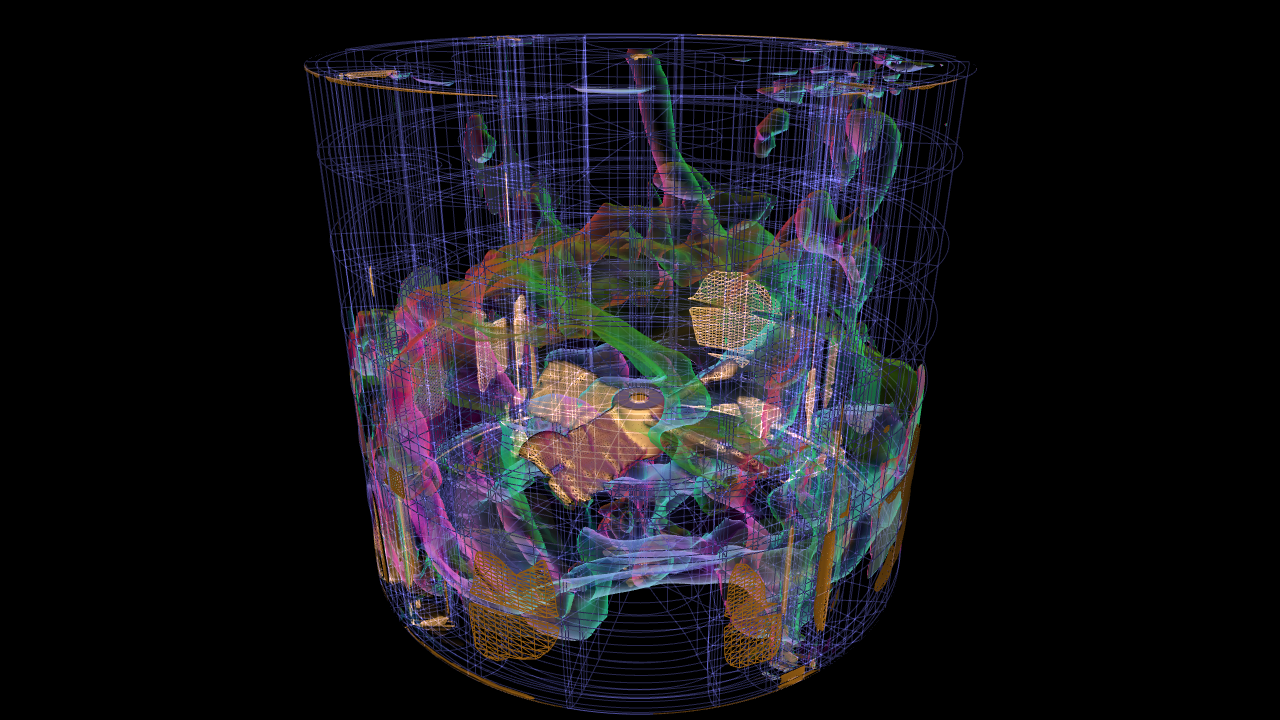
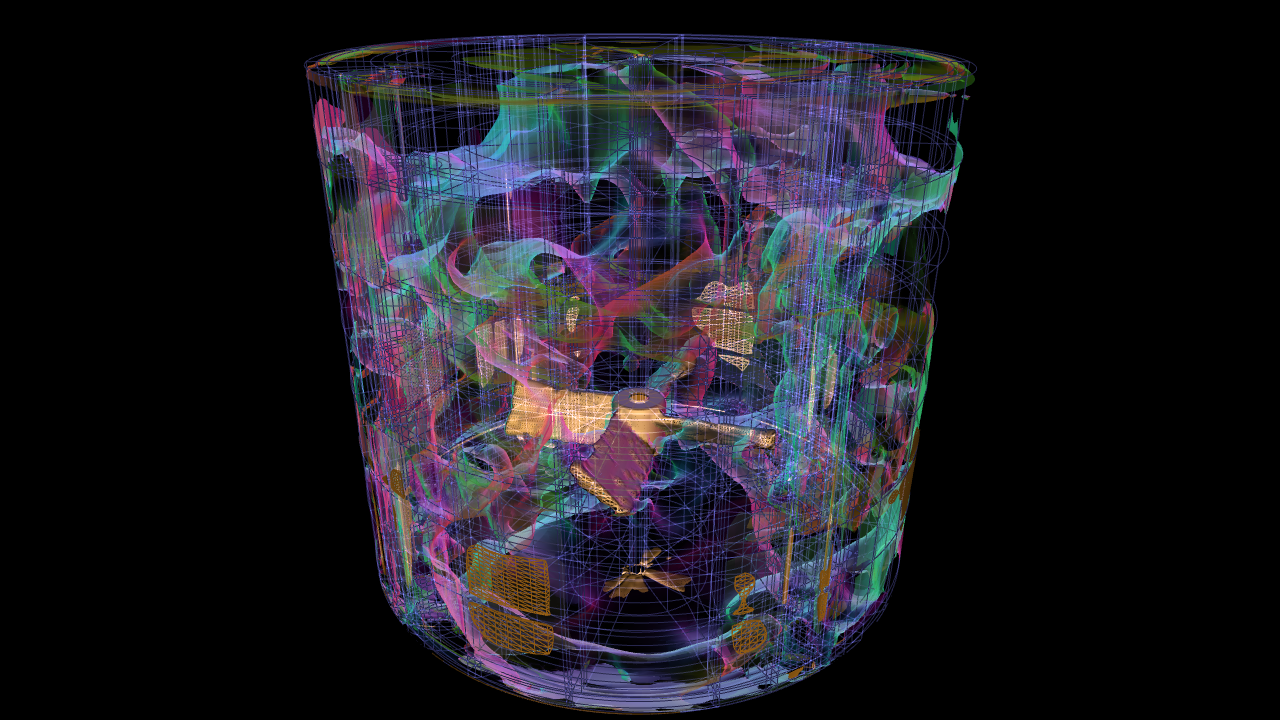
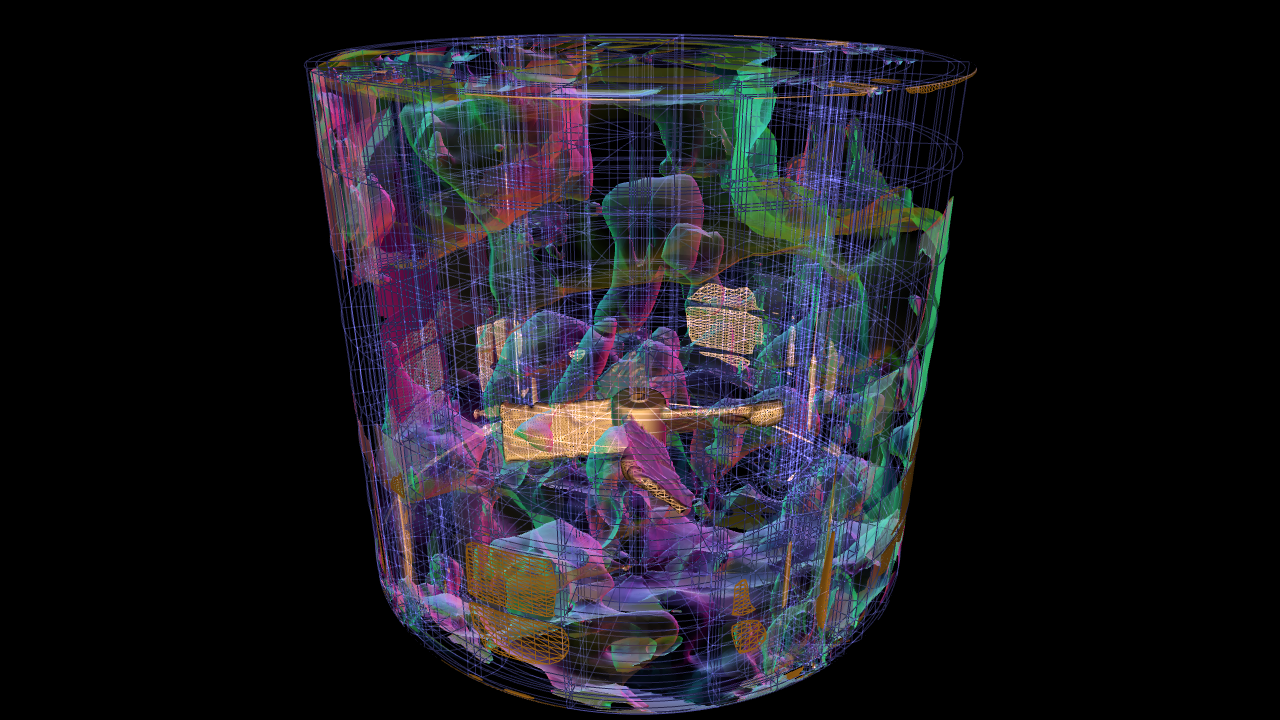
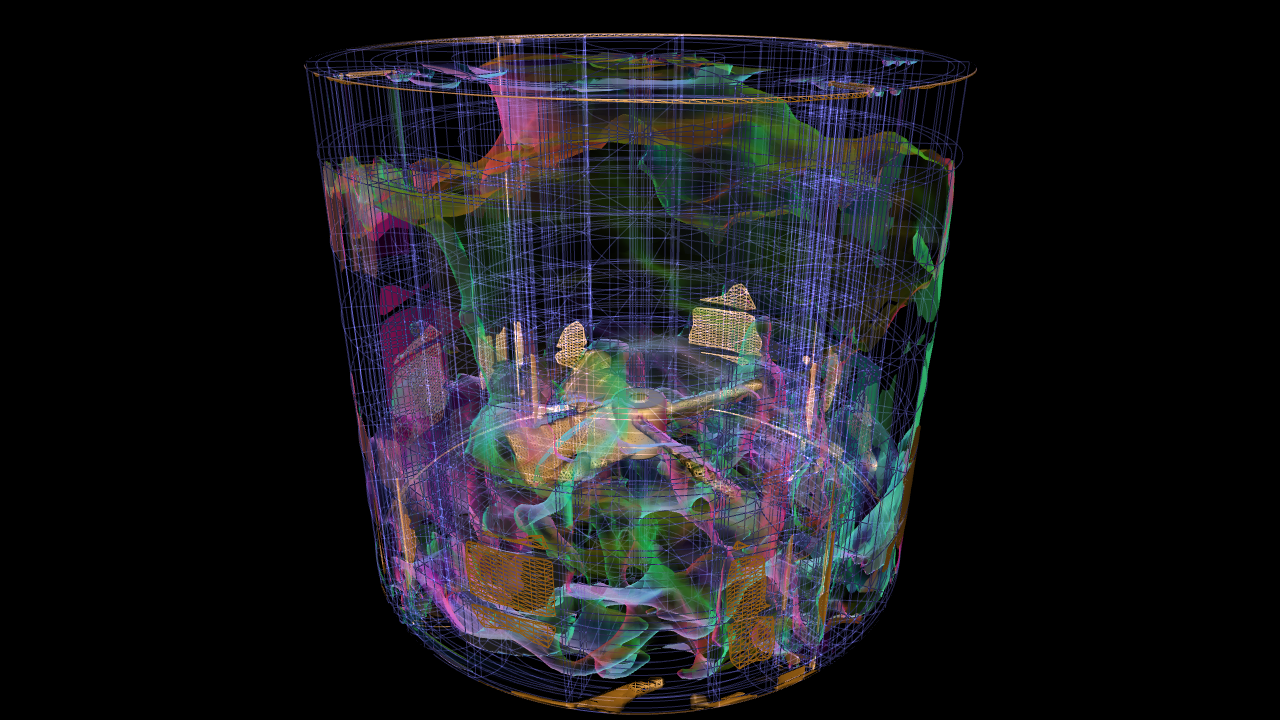
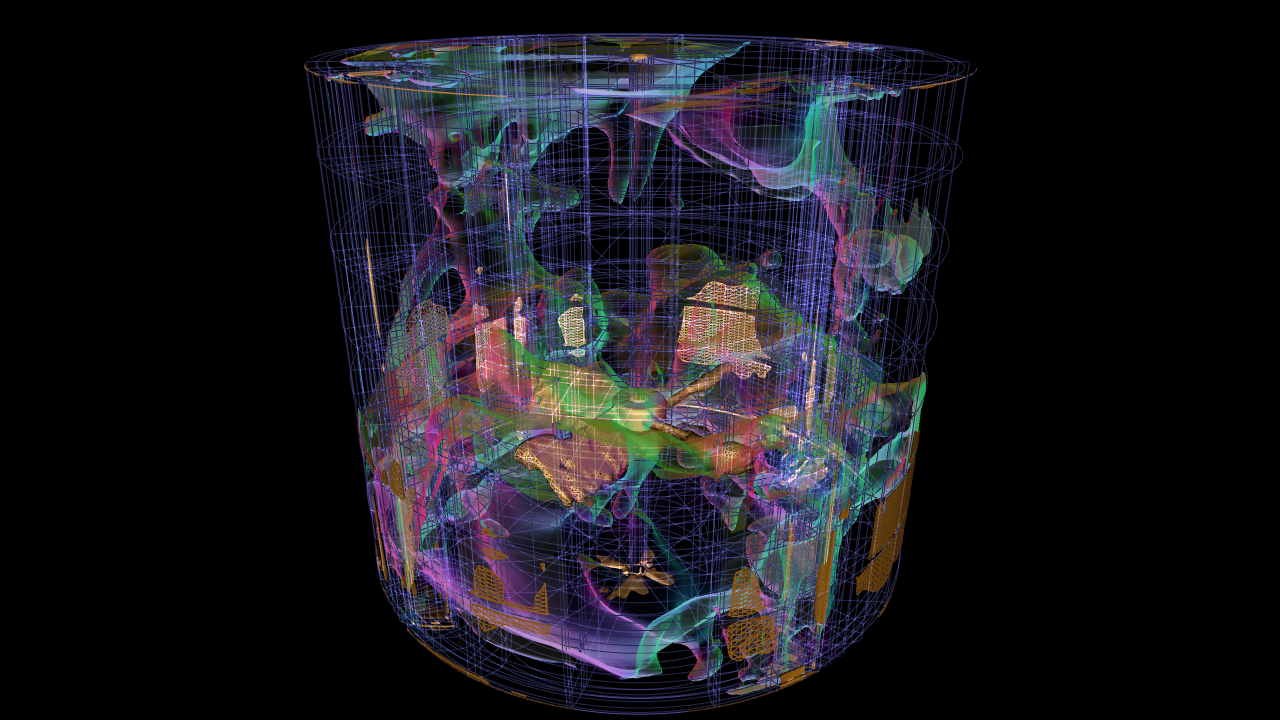
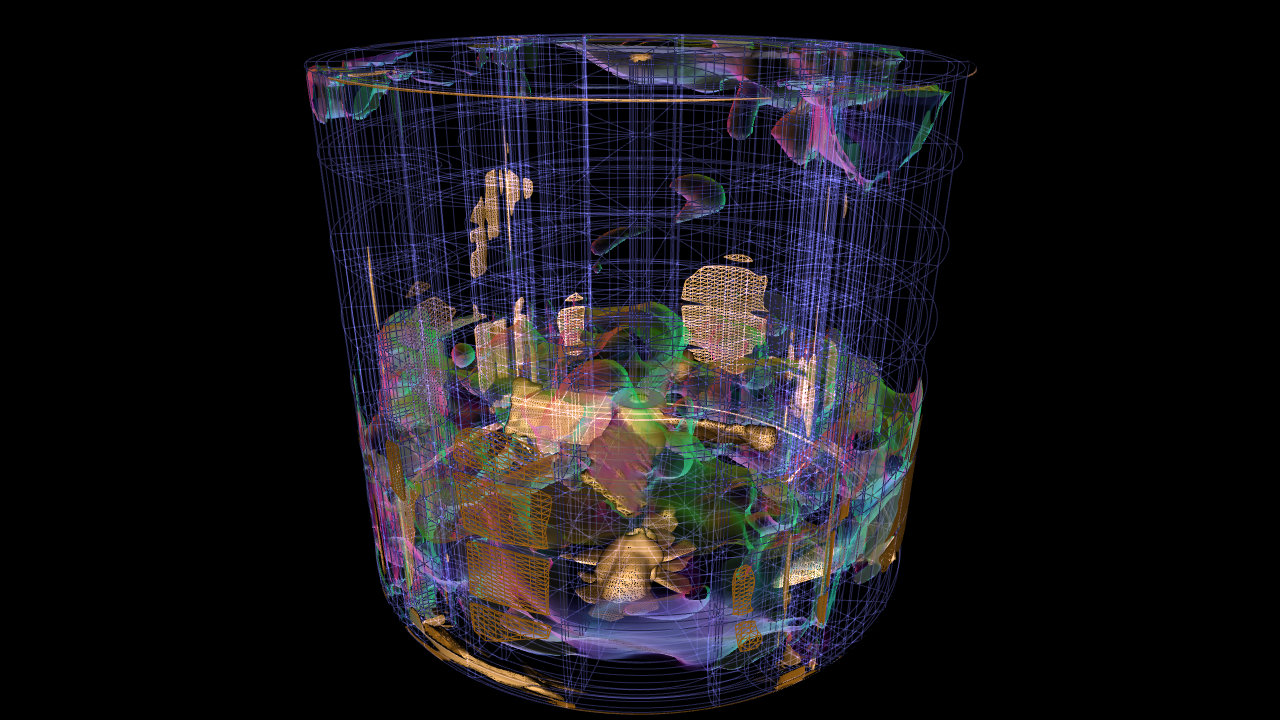
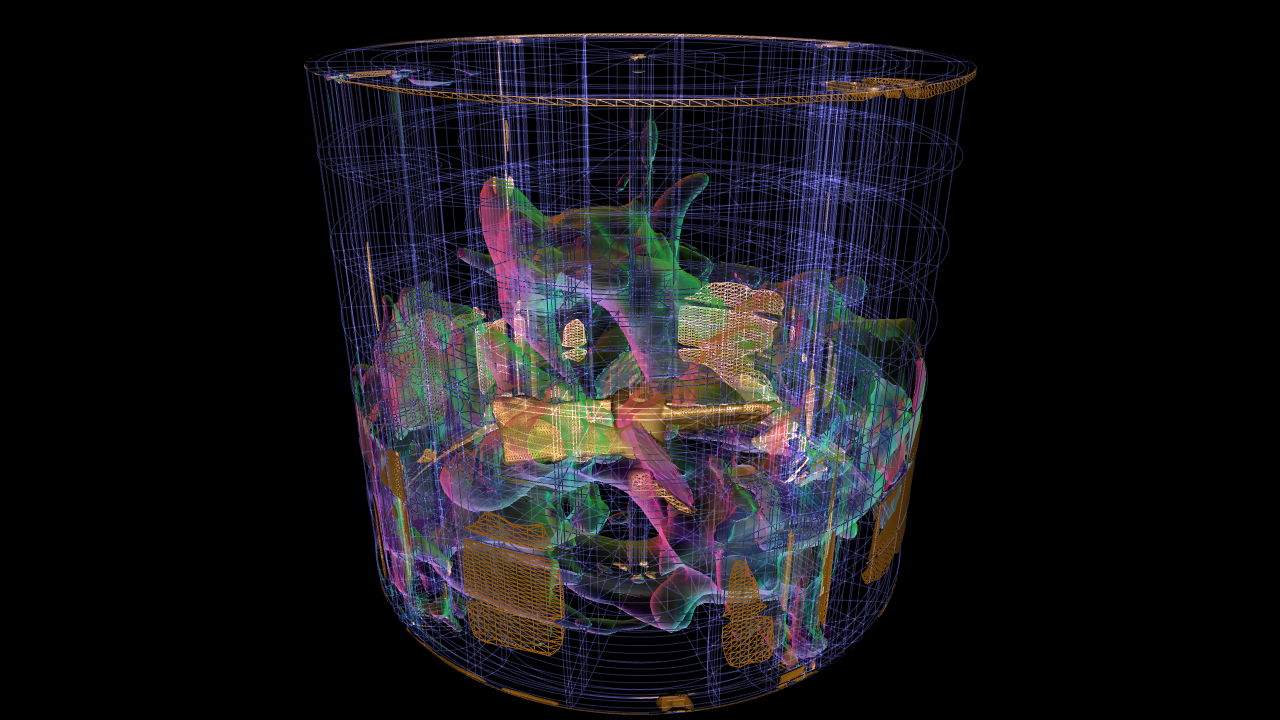
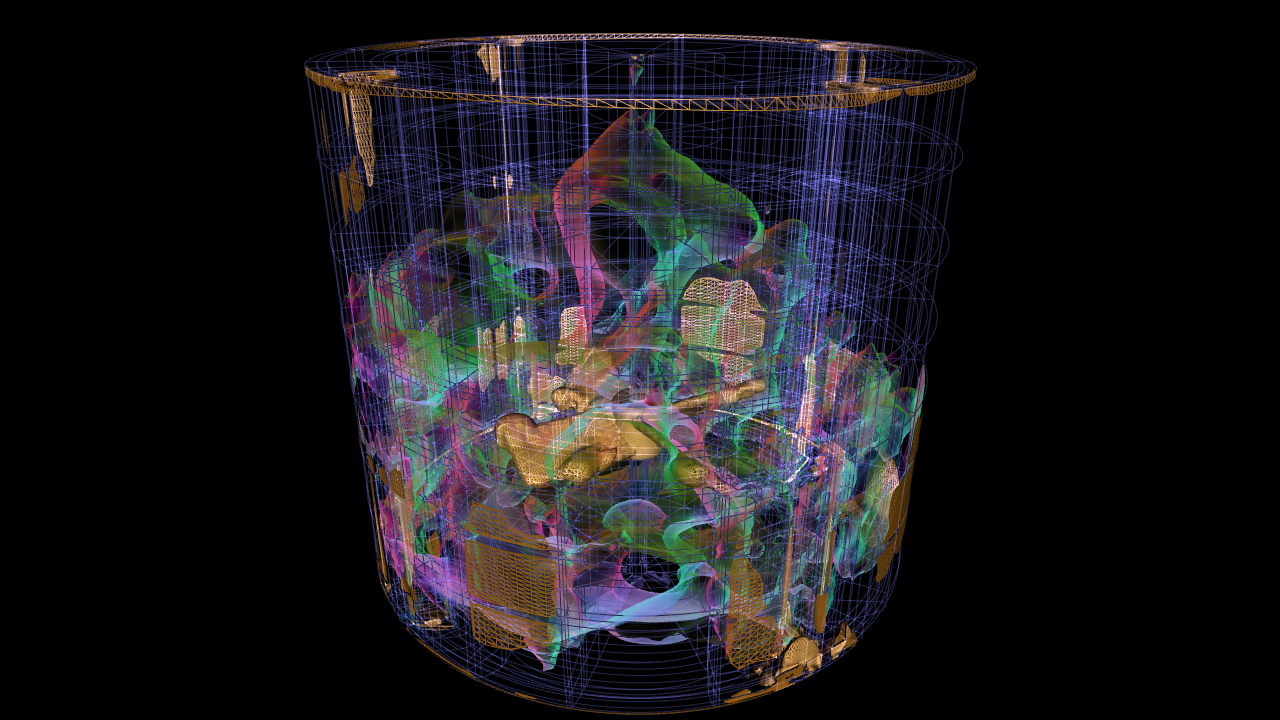
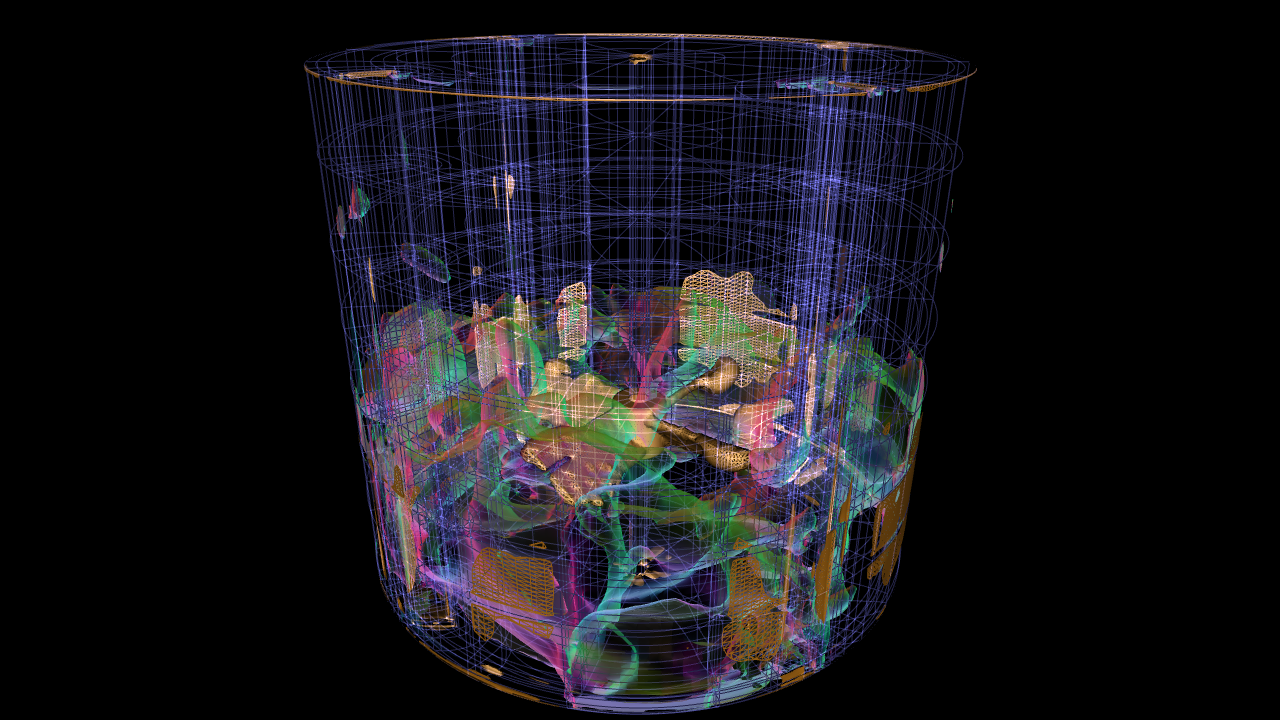
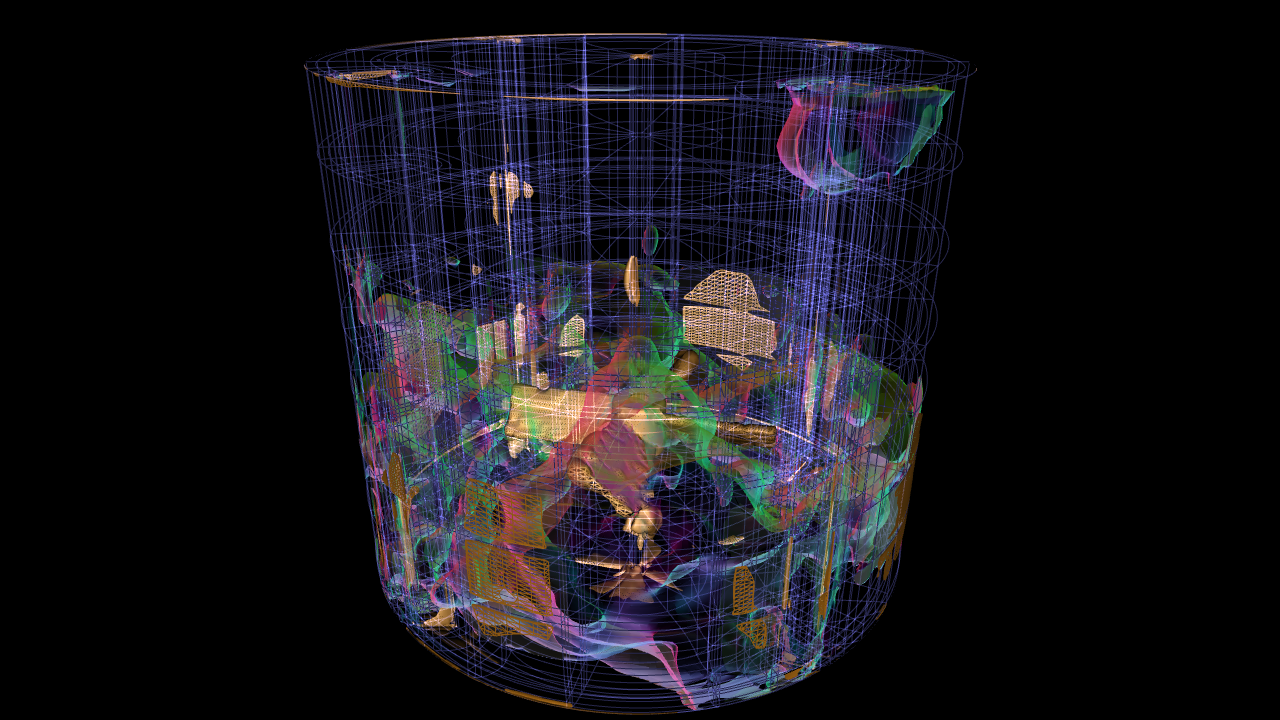
At our demonstration at the Supercomputing 2012 conference in Salt Lake City 2012 (CCT Booth) we will show such an interactive exploration of a dataset describing the fluid in a stirred tank, using the Vish Visualization Shell. It allows to navigate in space (interactive 3D viewer) and time through the full dataset interactively, even using a modest desktop computer with just 8GB of RAM. Data are loaded on demand but cached in memory as long as they are used, allowing replay of loaded time steps at 30 frames per second, whereby several visualization parameters can be changed at the same time. For replay loading the entire dataset is not required, however random access to any time step in the full dataset is enabled as well. Opening the data file and reading the required metadata to enable such random access requires less than a second, access to another time step to load from disk is seemingly real-time. This high-speed access to the rather complex dataset – a curvilinear grid made from 2088 blocks, distributed over 5700 time steps, providing scalar- and vector fields (pressure, velocity) in each block – is only possible via smart data layout in the F5 file format, which is based on HDF5. The F5 file format organizes data in a hierarchy of six levels, each related to a certain semantics of the dataset, and provides ultimate performance via reverse lookup tables that cache various information that is generically required for scientific visualization of time-dependent data.
The Visualization of the Stirred Tank Dataset used for the Presentation won the Cover Competition 2012 for the Coalition for Academic Scientific Computing and is used on the cover of the CASC2012 Brochure.

Demonstration Booth for Vish@SC12.
Booth at Supercomputing 2012.