TODO’s
 Download this page in PDF format
TODO Items
The Bathymetry Display:
- Allow to set the thickness depending on the height of the grid. The height of the grid can be retrieved by
RefPtr BBox = getBoundingBall(Context);
in the function addRepresentionProperties() or mayReuseAnemone(). The bounding box contains information about the height of the grid (see Class BoundingBox).
- Document the behavior of non-linear height mapping:
- Show how different values of thickness and power affect the display
- For power smaller than zero, we get compression of height layers around sea level
- For power larger than zero, we get stretching of height layers around sea level, compensating the behavior of the arcus tangens, and compression of layers at a height which is larger than the sea level, as well at the same height on a negative scale
- Determine at which level, for power larger than one, the maximum compression occurs
- Reverse the formula and use more intuitive values as inputs:
- allow to specify the thickness of the first height layer, and compute the power and (internal) thickness parameter from this value (creating power smaller than one)
- allow to specify the height level where we want maximal compression, and allow to specify a value for the intensity of this compression such as the thickness of the height layer at this level of maximal compression
- try to make the cases for power <1.0 and power >1.0 similar in parameters
- Allow to use different power values for negative and positive regions
- Use 10 colors in each direction, which each of them is clearly distinguished (http://en.wikipedia.org/wiki/Hypsometric_tints), http://en.wikipedia.org/wiki/Cartographic_relief_depiction
- Add contour lines similar to


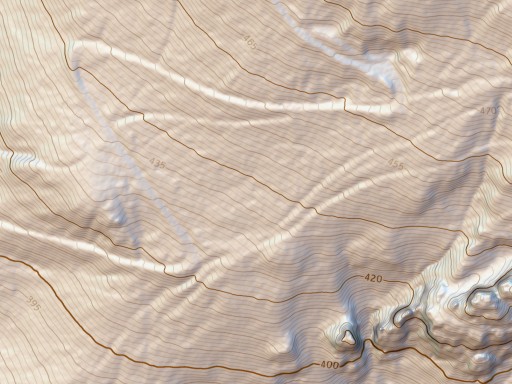 images such as the followings. The height lines would be black, in different properties, such as small for each 100m, thick for 500m, thick red for 1000m (but with adjustable scaling value of course, to be possibly 10/50/100m instead). In our case, height lines wouldn’t not be exact lines, but having some spatial extension.
 - Try to implement height lines without using if-conditions, but rather GLSL step()/smooth()/modulo() etc. functions. This would be much faster but also more elegant.
- Maybe it is possible compensate for the “broadening” of height lines if we take the gradient into account, which is available through the normal vector field of the surface. Need to think about this.
- Allow for some scaling which is relative to non-zero sea level. This will need to be done via OpenGL matrix transformations:
- translate
- scale
- translate back
Currently it is only doing the scaling part, but not the translation. This requires parameter support for translations in the VGLRenderContext, and setting the three parameter with different tentacle order such that their execution order is defined (insertTentacle() instead of insert().
- Further Inspiration: http://www.ssg-surfer.com/html/surfer_details.html
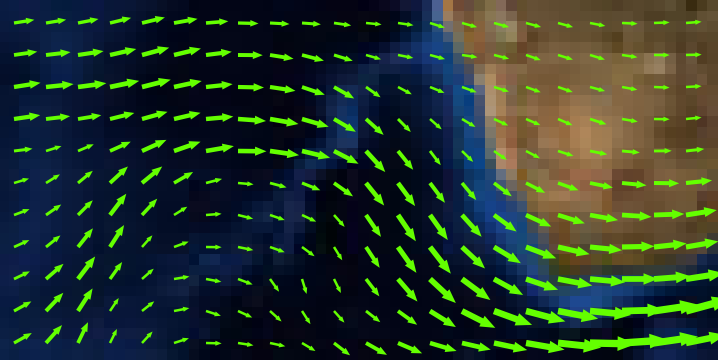
Ocean Waves:
- Load wind vector field as data set – code similar to loading normal vectors
- Support time dependent vector fields, as analytic example use a vector field of type (-y, x,0), which is a swirl, and let it move around a running center, like

- Compute normal vectors of the waves, depending on analytic formula for the waves
- Refine large triangles into smaller ones for higher resolution using a geometry shader (see next item)
Vector Display
- Create a module to display vector arrows at each vertex of a surface, using geometry shader
- Two display modules:
- One very simple one, only drawing arrows as lines, similar to the current vector arrow module
- One more advanced which displays arrows as three-dimensional objects, find inspiration on options at google image search for ‘vector arrows’
- 3D arrows should be general to work just on any kind of vertex information, but maybe we want to have some vector arrow display that is specifically for surfaces; above google image search yields a couple of vector arrows that are ‘flattened’ in 3D, which means they have some preferred direction encoded in addition to the vector direction. Such direction can be a surface’s normal. Eg:
- More advanced vector arrow module displaying curved arrows, making use of an additional vector field describing the curvature of the vector field. This requires also a module to compute the curvature of a vector field on a surface. Currently we have curvature computation only on lines.
Waves on triangular Grid
Possible ideas to implement:
- http://www.youtube.com/watch?v=Hrmk-u7QB-M -comes with nice, short source code, but seems to be tight to an hexahedral grid of constant triangle size. We have a more complex situation so this code will need to be generalized.
- Might need algorithm to compute vertex neighborhood, maybe code such as http://www.csse.uwa.edu.au/~ajmal/code/pointCloud2mesh.m can be useful.
- A good paper is http://research.microsoft.com/en-us/um/people/cloop/msrtr-2000-24.pdf . We should implement suitable functionality in the context of our data structure.
- Anuga (http://sourceforge.net/projects/anuga/) sounds interesting. Maybe we can run it on our grids to simulate waves easily? Give it a try, installing Anuga, and let’s check if we can read and visualize its demo data files.
more…?