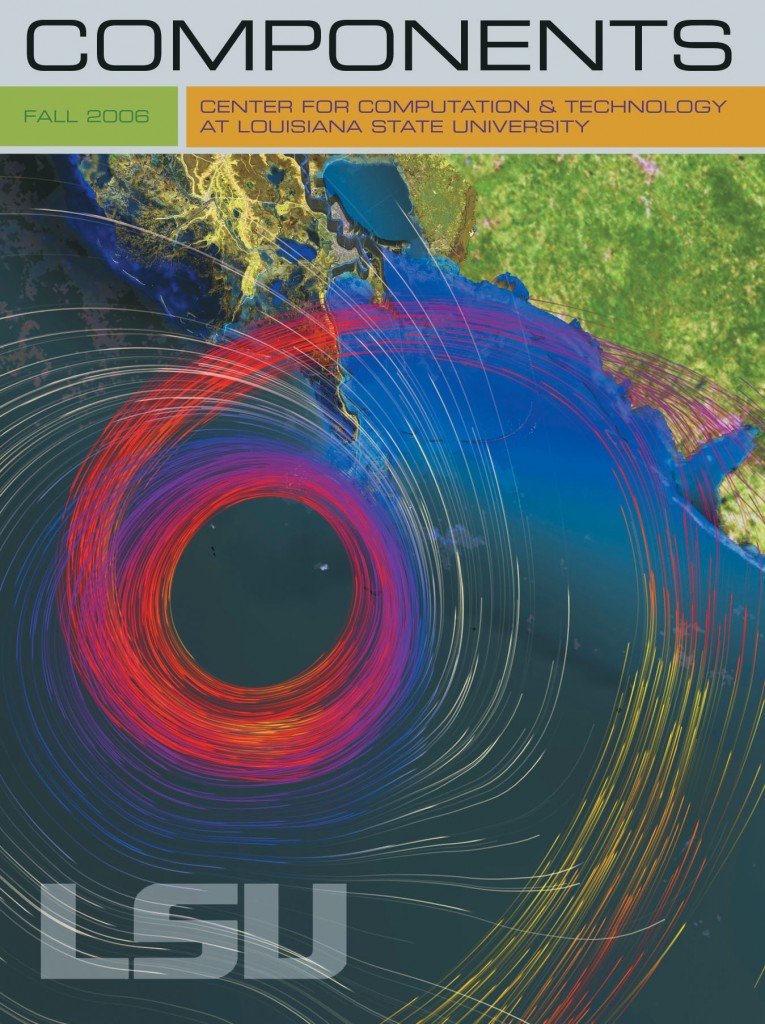
Hurricane Katrina
The visualizations below of Hurricane Katrina’s storm surge on the Louisiana coast were created for Cinegrid 2007 at the LSU Laboratory of Creative Arts + Technology (LCAT) by the CCT sci-viz group: Steve Beck, Werner Benger, Amanda Long, and Shalini Venkataraman. Currently we have input from various data sources combining the New Orleans LIDAR elevation model, GOES-12 satellite images, MODIS ground images, MM5 atmospheric 3D simulation data (temperature, wind velocity and pressure) and finally hindcast ADCIRC surge simulation data and the levee alignments. Special thanks to the Earth Scan Lab, Coastal Studies Institute at LSU and the ADCIRC Development Group for providing the data visualized below.
Gallery
 Download this page in PDF format